Building Height Attribute in ArcGIS Pro
Building Height Attribute in ArcGIS Pro
Please note: these instructions were prepared using ArcGIS Pro version 3.4.0
Background information on OS MasterMap® Topography Layer Building Height Attribute and details of the attributes supplied by Ordnance Survey can be found on the Building Height Attribute Overview page.
BHA data can be downloaded from the download data tab in File Geodatabase format which makes it much quicker and easier to view the data in 3D.
Download the data
Download the following data products for your area of interest from Digimap using the OS download data tab in Digimap:
- BHA data (BHA data is found in the OS MasterMap®category): select File Geodatabase as the format;
- OS Terrain™ 5 DTM: this will be used as the base (surface) heights for the area to provide a more accurate terrain model than is available by default in ArcGIS Pro;
- Optionally download any additional data you may wish to use as a backdrop, such as OS VectorMap® Local Raster or 1:25 000 Scale Colour Raster;
Open ArcGIS Pro
- Open ArcGIS Pro.
- Create a new Project.
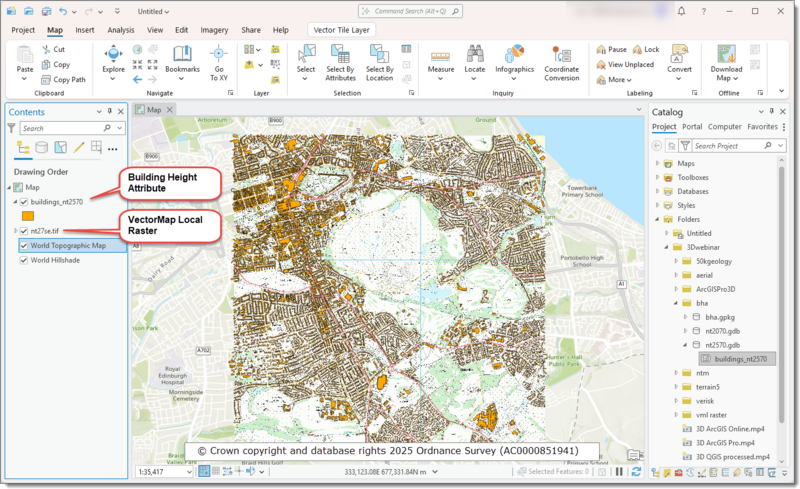
- Add a New Map to the project and load in the BHA data.
- Add any additional data you wish to display, for example OS VectorMap® Local Raster.
Visualising the data in 3D
Step 1
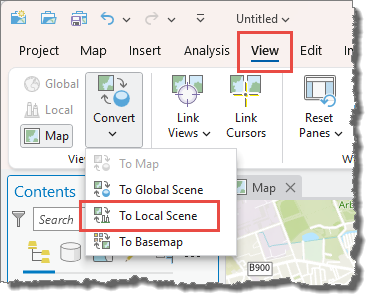
On the View tab, press the Convert button and select ‘To Local Scene’ to convert the scene from 2D to 3D:
Step 2
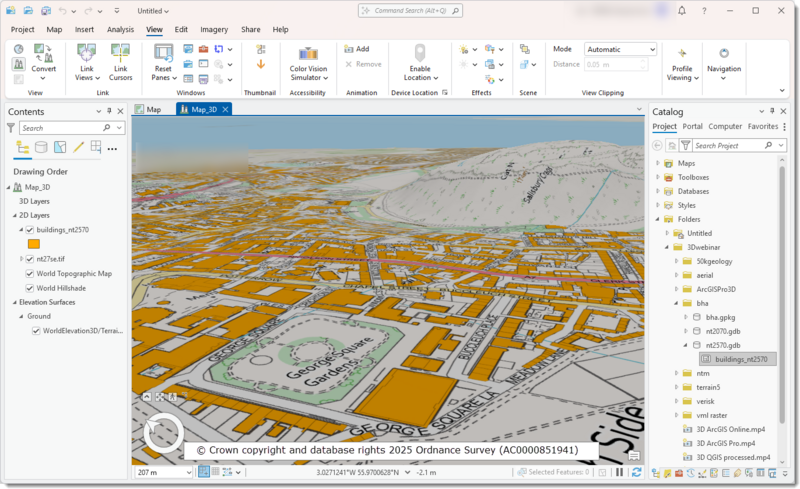
If your map does not display you may need to right click on your building layer and select ‘Zoom To Layer’ from the popup menu and your map should then display in 3D:
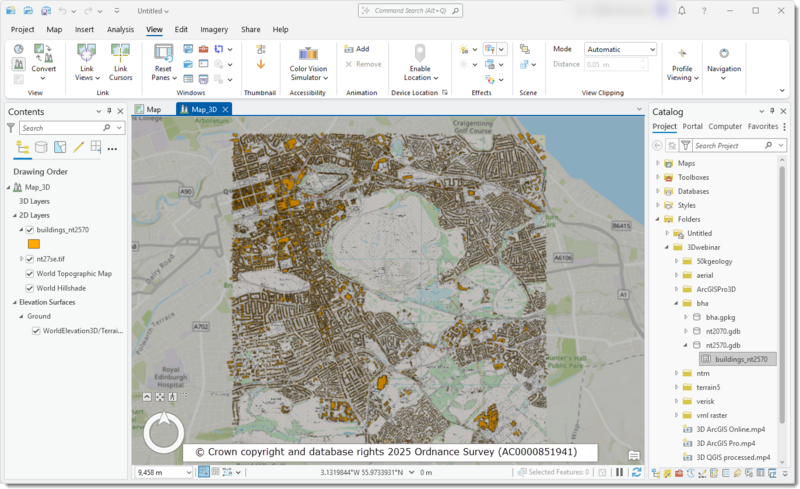
If you zoom in to an area you will notice that your buildings are still in 2D:
Step 3
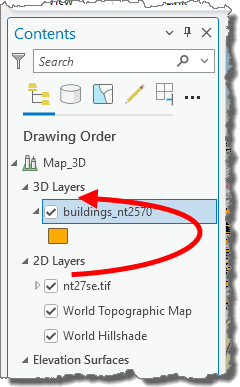
Before you can extrude your buildings in to 3D you need to drag the building layer from the ‘2D Layers’ section to the ‘3D Layers’ section in the Contents panel:
Step 4
With the building layer selected in the Contents panel, go to the Feature Layer tab and note that the Extrusion controls are now enabled:

Step 5
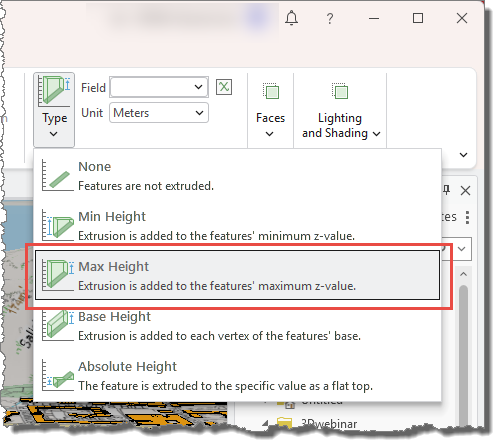
Using the ‘Type’ drop down, select an appropriate extrusion method. In the screen grab below we have selected ‘Max Height’:
Step 6
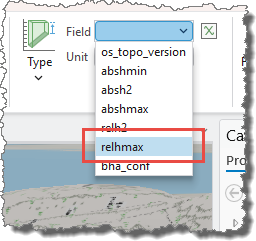
- In the ‘Extrusion Expression’ drop down, select the attribute to which you wish to use to extrude the buildings.
- Note as we are extruding from a surface height you should use one of the two relative height attributes for the extrusion, relhmax or relh2.
- See the Building Height Attribute Overview page for an explanation of the attributes:
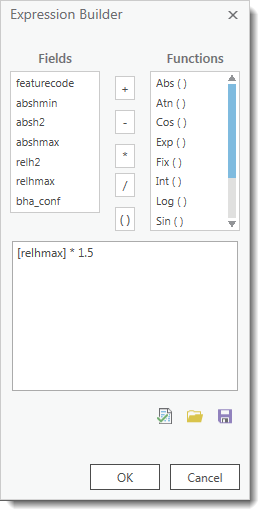
Note: to exaggerate the vertical extrusion of the buildings you can use the ‘Expression Builder’ to enter a suitable expression.
For example an expression of [relhmax] * 1.5 would cause the buildings to be drawn 50% taller than they really are:
Step 7
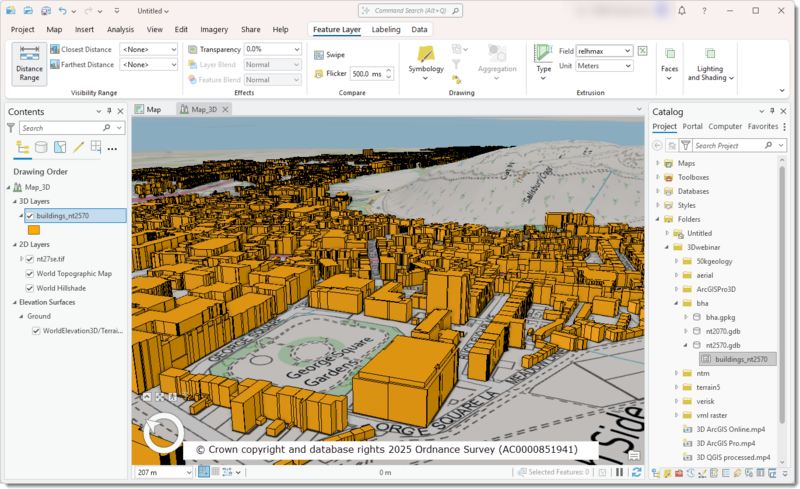
Your buildings will now be displayed in 3D, you can modify the styling as required using the Symbology panel:
Applying more realistic styling
Step 1
To display the buildings with a more realistic appearance you can use on of the built in Procedural Symbols, but these must first be added to your ArcGIS project.
To do this go to the Insert tab and select ‘Add System Style’ from the ‘Add’ drop down in the Styles group:

Step 2
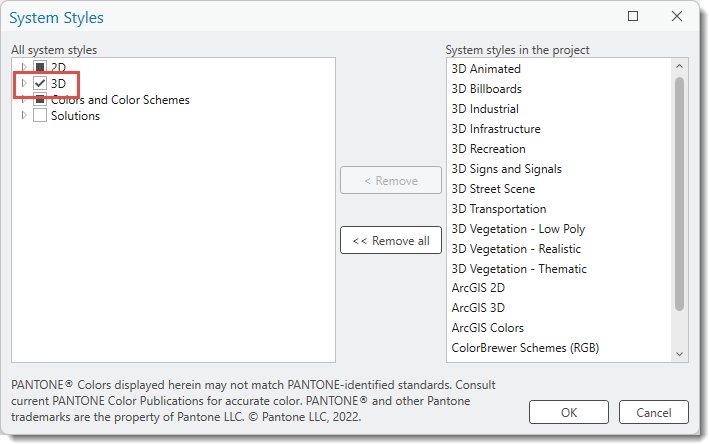
In the ‘System styles’ window select the 3D checkbox on the left hand side and press the OK button:
Step 3
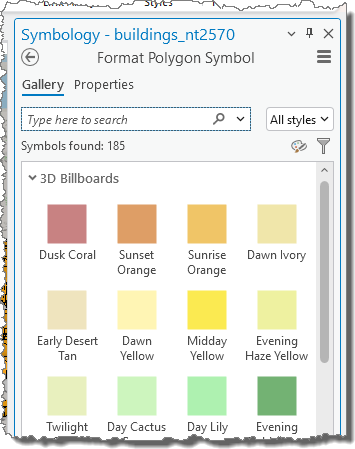
Now select the current symbol in the Contents panel on the left hand side to bring up the Symbology panel:
Step 4
In the Gallery section, scroll to the bottom of the available styles and then select the ‘International Building’ style under the Procedural Symbols heading:
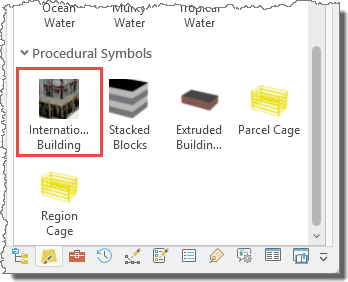
Step 5
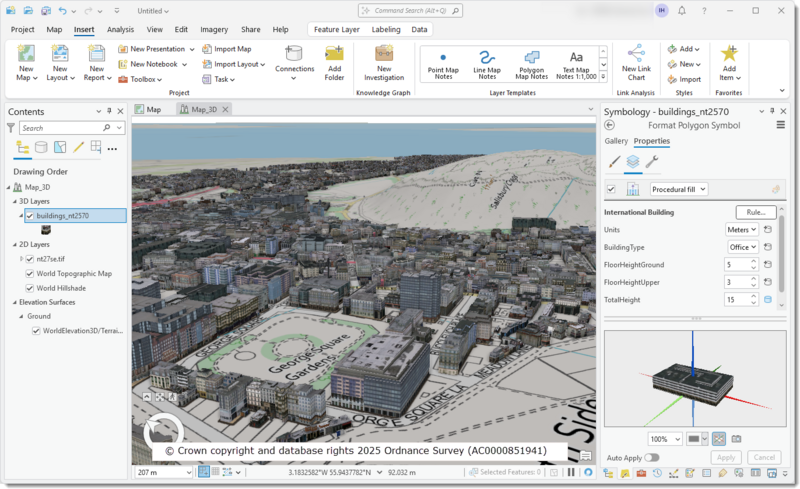
Your buildings will look more realistic, but note that they all now have the same height. This is because the height of the buildings has been specified in the symbol and it overrides the extrusion that we set before. It is easy to modify the height in the symbol.
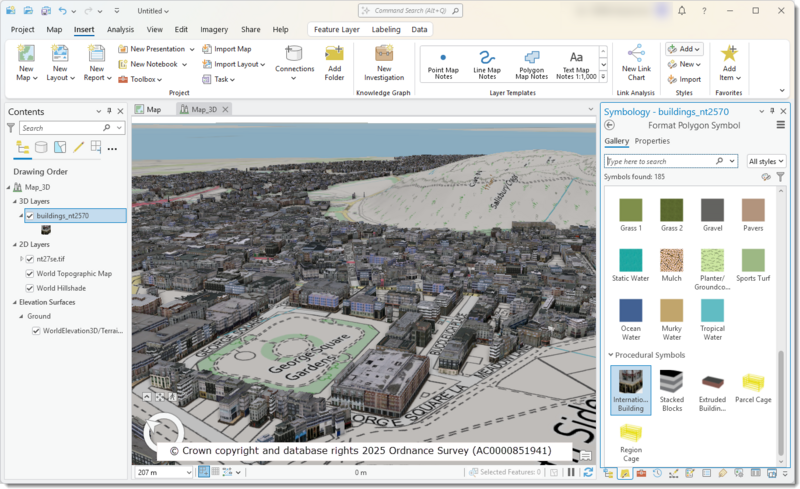
Select the symbol in the Contents panel to bring up the symbology panel, then select the Properties link followed by the Layers control:
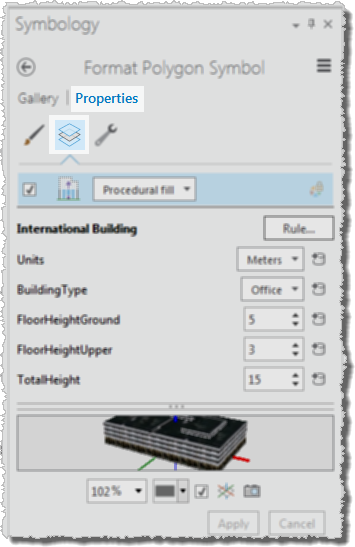
Step 6
You will see that there is a layer called ‘TotalHeight’ which has a value of ‘15’ against it (this means that all buildings are being drawn 15 metres tall):

Next to this field select the Attribute Mapping button.

Then select the attribute you wish to use for the height of the building, as before we will select ‘relhmax’, press the OK button to close the window:
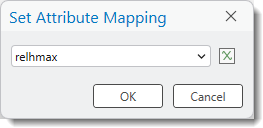
Step 7
On the Symbology panel select the Apply button to update the styling:
Using more detailed terrain data (OS Terrain™ 5)
By default ArcGIS Pro uses a global elevation dataset. When doing detailed studies of small sites it may be appropriate to use more detailed terrain data available from Digimap, such as OS Terrain TM 5.
Step 1
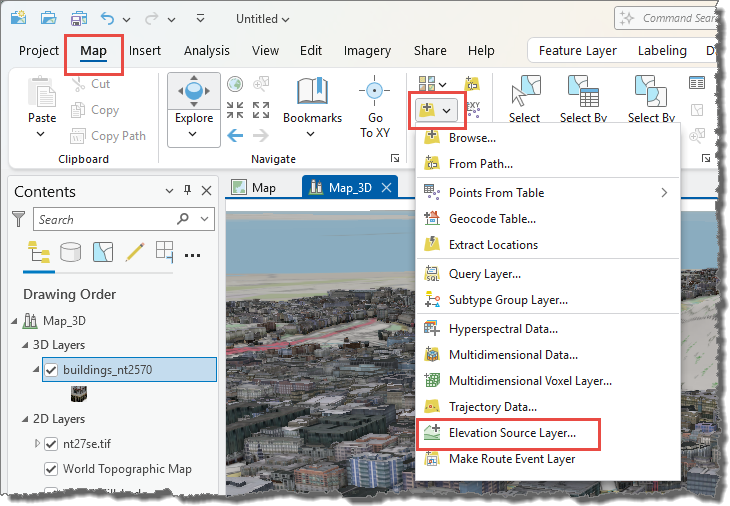
On the Map tab select the ‘Add’ button (in the Layer group) and select ‘Elevation Source Layer…’ from the list of options:
Step 2
Browse to your DEM data downloaded from Digimap and press the OK button.
Step 3
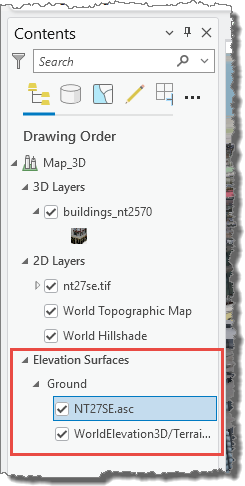
In the Contents panel you can move different elevation datasets up and down in the list. In the default setting any locally added terrain datasets will be used in preference to the ArcGIS Pro default surface, but in areas where no locally added terrain exists the default ArcGIS Pro surface will be used instead:
Step 4
Press the OK button to save your changes and display the more detailed terrain surface.
Adding additional styling and data
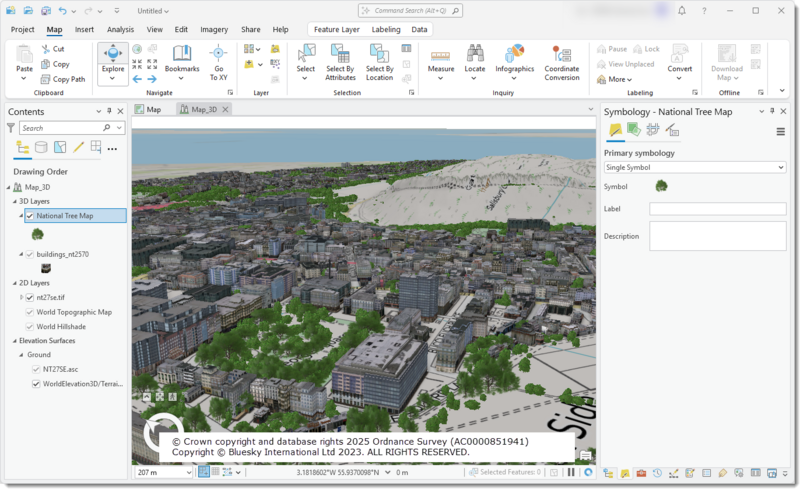
You can display additional data on your visualisation and style it appropriately. For example you could display trees (see screen grab below) which are provided in the National Tree Map dataset; the locations of phone boxes, post boxes and bus shelters are all provided in the Points of Interest dataset.
