Display raster & vector data in AutoCAD
Displaying raster and vector data in AutoCAD Map 3D
Please see the Autodesk Summary page for details of overlaying other datasets in Autodesk software, or the Rhino help page to display DTM and BHA data in Rhinoceros 5.
Loading raster ASCII data in to AutoCAD Map 3D
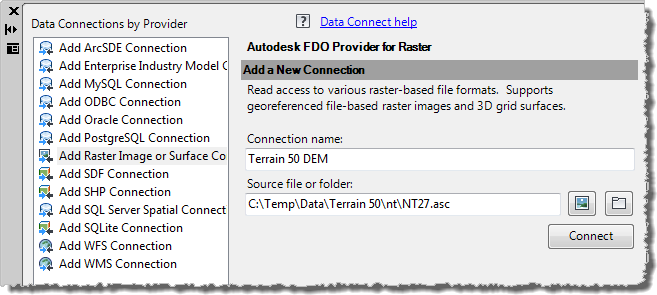
1) To load raster ASCII data in to AutoCAD Map 3D select Data then Connect to Data from the Task Pane:
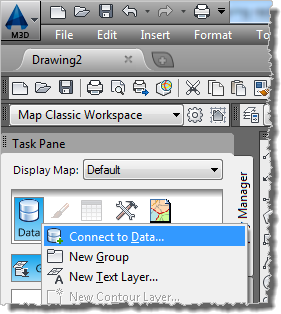
2) This will open up the Add New Connection window:
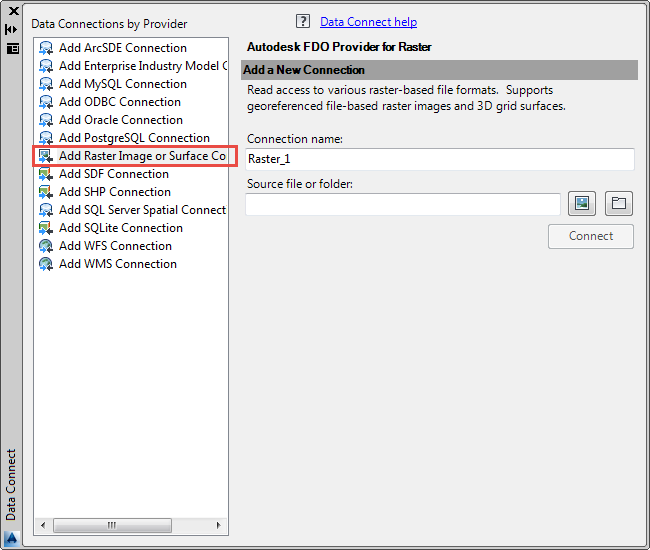
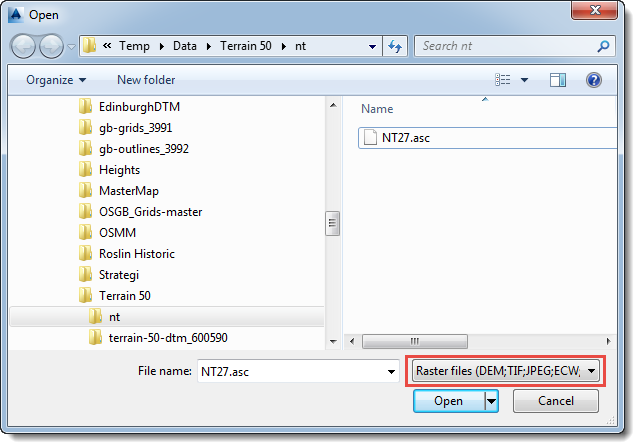
3) Select Add Raster Image or Surface Connection (highlighted in the image above) and browse to the raster dataset supplied by Digimap. Ensure the file type drop down is set to Raster files:
4) Give your connection a name and press the Connect button:
5) At this point it is advisable to set the coordinate system. Terrestrial data supplied by Digimap uses the British National Grid projection. The coordinate system is set by double clicking on the layer and then selecting the appropriate projection:
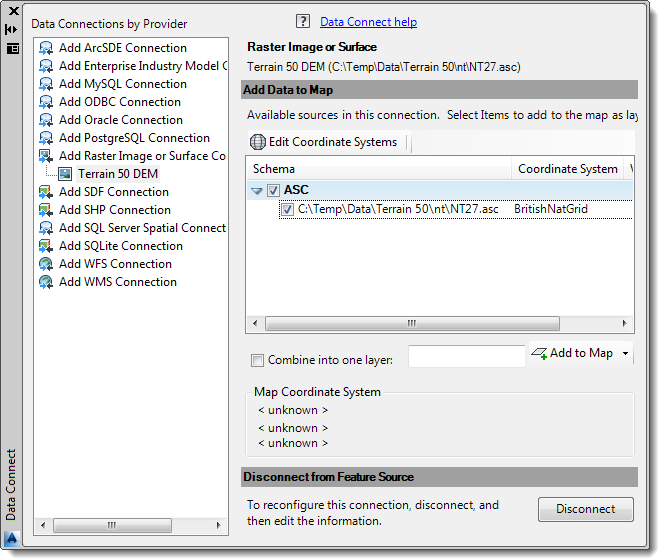
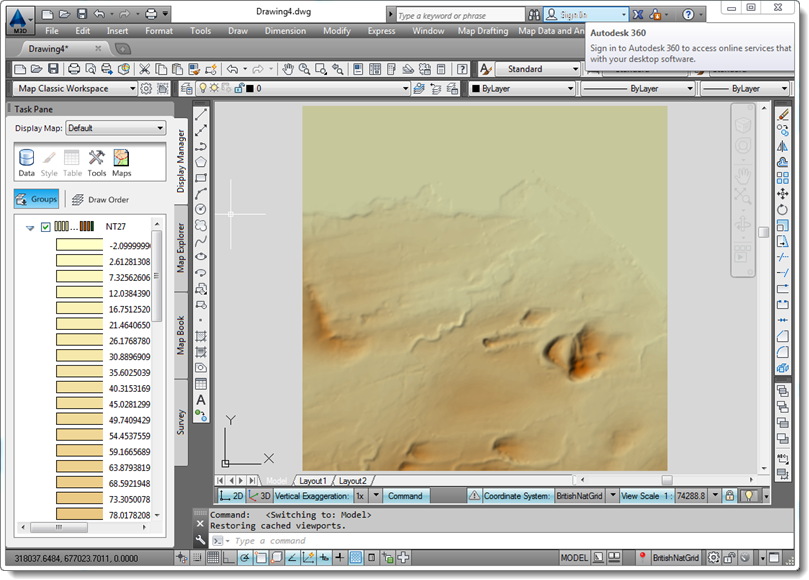
6) To display the data press the Add to Map button:

7) The DEM will be displayed using a default palette, this can be modified by double clicking on the layer in the task pane to bring up the Style Editor window where you can adjust the colours and number of classes used to display the data.
Draping raster and vector data over a digital elevation model
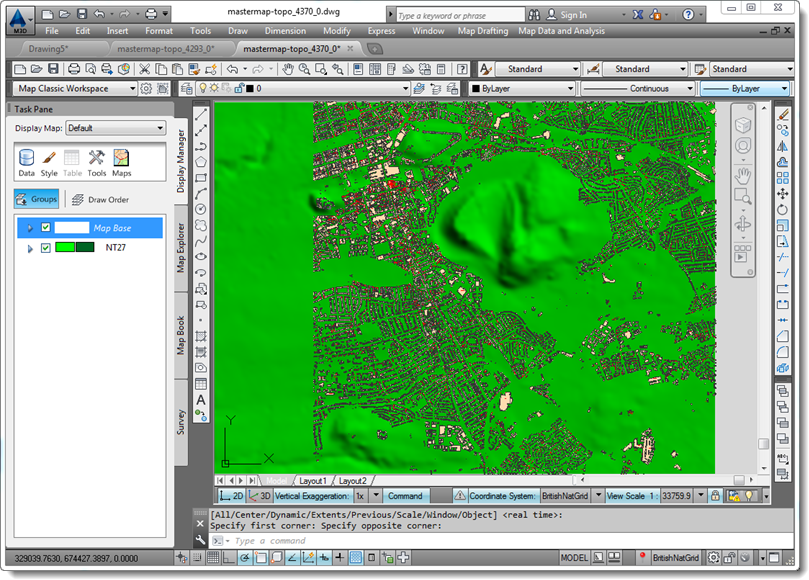
- Vector data can be added to the window either as DXF/DWG files or as other data connections using the Connect to Data menu. The following image shows buildings from OS MasterMap® Topography Layer overlaid on the DEM:
-
Note: Vector data added as DXF/DWG files will only appear draped over the DEM when viewed in 3D if the value for Elevation has been set on the features (and is above the level of the DEM).
-
Raster data added using the Connect to Data menu will appear draped over the DEM by default (although the resolution may appear relatively poor).
Viewing the data in 3D
1) To view the model in 3D click on the 3D mode icon:
 .
.
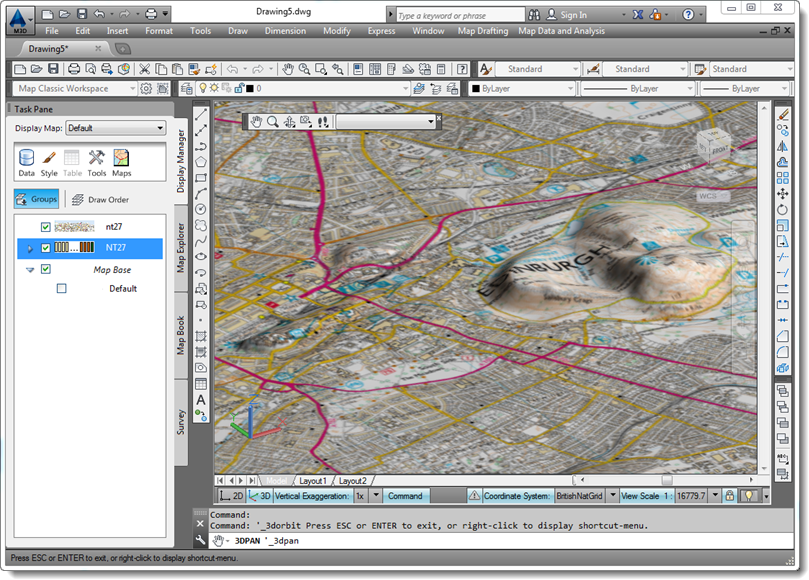
2) The following shows the 25K raster draped over the DTM in 3D:
