Building Height Attribute in QGIS
Introduction
Please note: these instructions were prepared using QGIS version 3.34 and Qgis2ThreeJS version 2.8.
Background information on OS MasterMap® Topography Layer Building Height Attribute and details of the attributes supplied by Ordnance Survey can be found on the Building Height Attribute Overview page.
BHA data is available from Digimap in File Geodatabase format, which can be read by QGIS without requiring any processing. It is easy to visualise BHA in File Geodatabase format using a freely available QGIS plugin. The following steps describe the process in detail.
Getting started
Download the following datasets for your area of interest from Digimap using the OS download data tab in Digimap:
- BHA data (BHA data is found in the OS MasterMap®category): select File Geodatabase as the format.
- OS Terrain 5 DTM: this will be used as the base (surface) heights for the area.
- Optionally download any backdrop data, such as OS VectorMap® Local Raster, or 1:25 000 Scale Colour Raster.
Visualising the data in 3D
Visualising the data in 3D in QGIS is achieved using the Qgis2ThreeJS plugin, which can be installed using the QGIS plugin manager. The steps below describe how to use the plugin to create a 3D model:
Load data
- Ensure you have all the data loaded in to your QGIS project that you wish to include in the 3D model, as a minimum you should have your DTM, the BHA dataset and a suitable map layer to drape over the DTM.
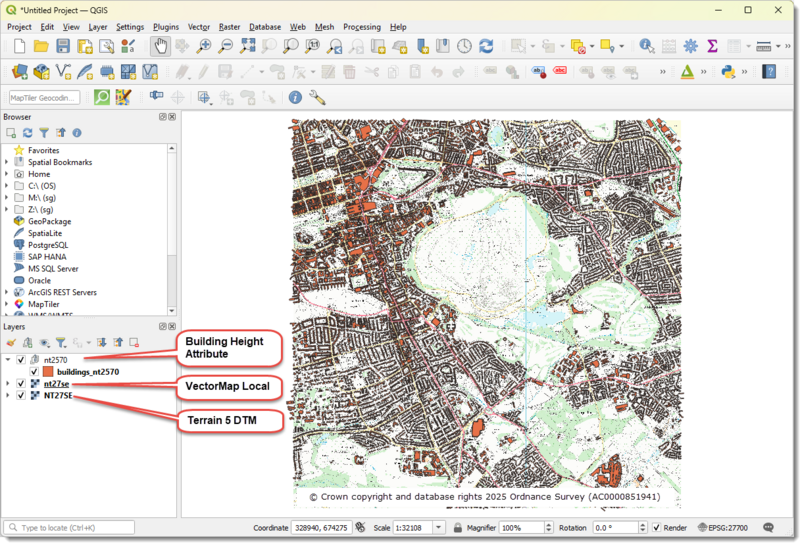
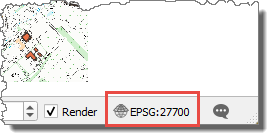
- Set the project coordinate reference system to British National Grid (EPSG:27700) if not already set.
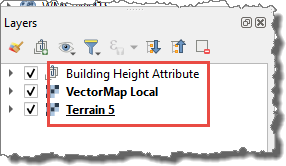
- Rename the layers in the Layers panel to make them easier to use.
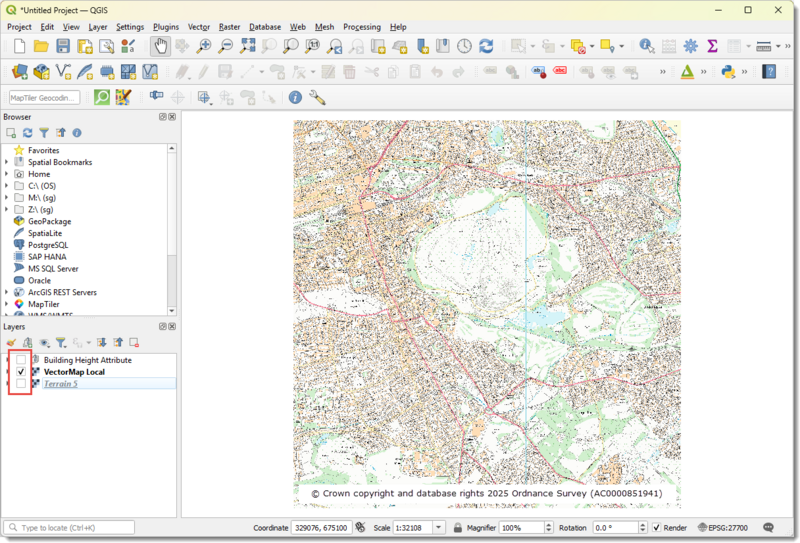
- Turn off all layers in the Layers panel apart from the surface you wish to drape over the DTM; the buildings will be styled using the Qgis2ThreeJS plugin.
- Launch the plugin, which can be found on the web toolbar.

Settings
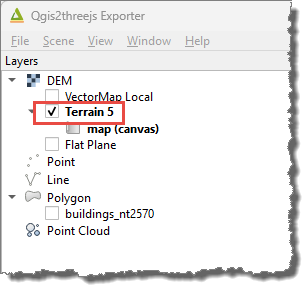
- The Qgis2ThreeJS Exporter window will display. In the Layers panel, in the DEM section select the layer in your map that is to be used as the terrain surface, in this example we are using the Terrain 5 layer as the terrain surface.
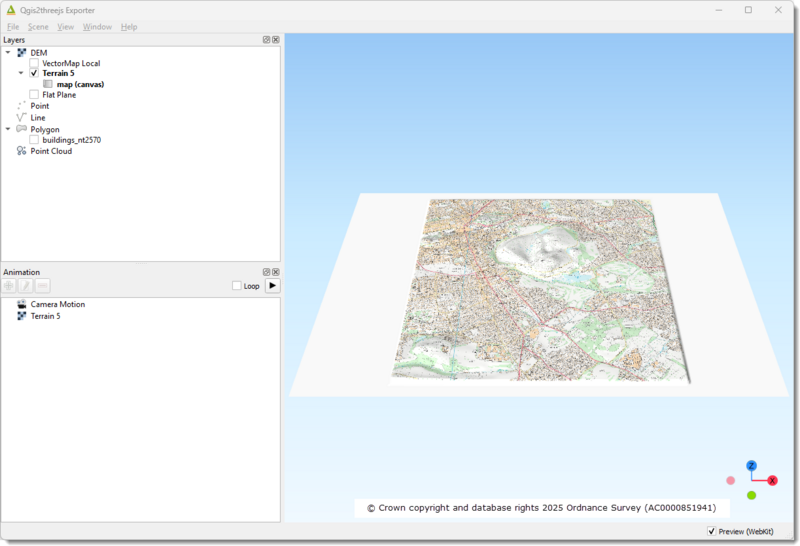
- By default the 3D scene will be created for the extent of the map canvas, as shown below.
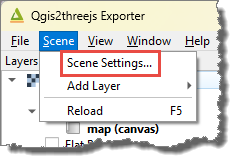
- It is possible to constrain the extents of the 3D scene to the extents of one of the layers loaded in to the map. To do this open the Scene Settings panel by selecting Scene > Scene Settings… from the menu.
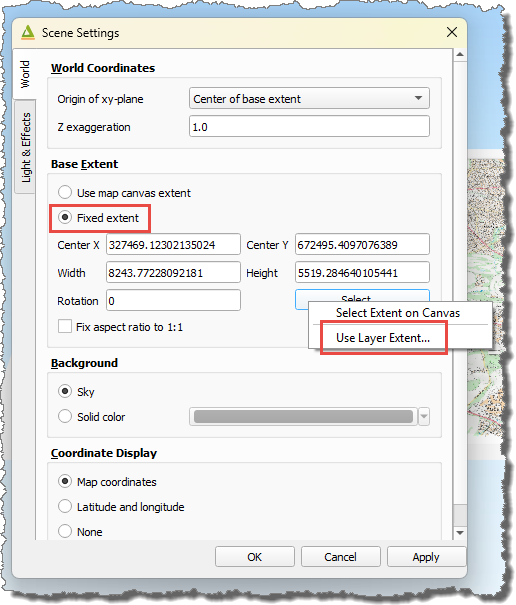
- In the Base Extent section, select the Fixed extent radio button, then press the Select button and choose Use Layer Extent… Select one of the layers added to the map, this will set the extents of the 3D scene to be the same as the extents of the selected layer.
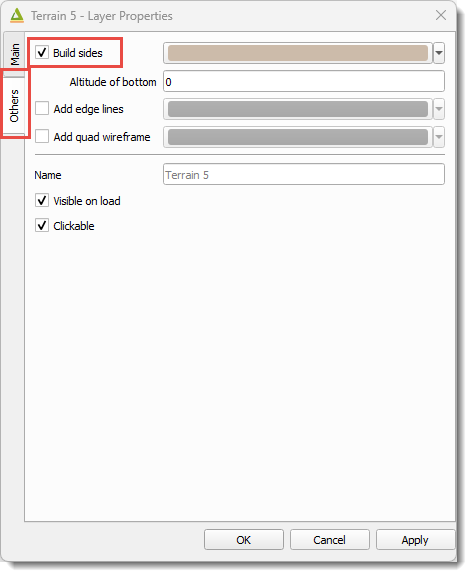
- Double click on the layer selected in the DEM section to bring up the Layer Properties window. Select the Others tab and select the Build Sides option. This will build sides to your 3D scene so you get a better understanding of the elevation across the scene.
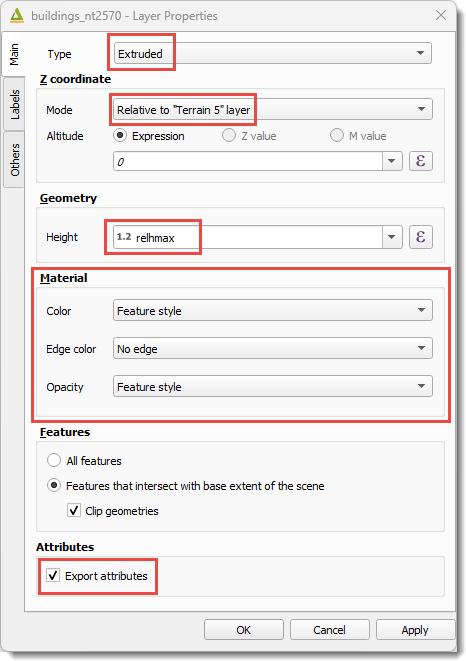
- Double click on the BHA layer to bring up the Layer Properties window. On the Main tab, set the following:
- Type: Extruded
- Mode: Relative to Terrain 5 layer
- Height: select ‘relhmax’ attribute
- In the Material section, set appropriate color, edge color and opacity values, as required
- If you wish attributes to be viewable when features are clicked in the 3D scene, select the Export attributes checkbox
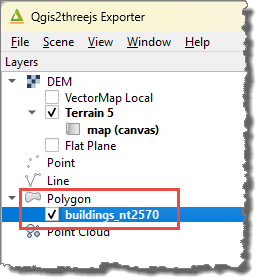
- Enable the buildings layer by selecting it in the Polygon section of the Layers panel.
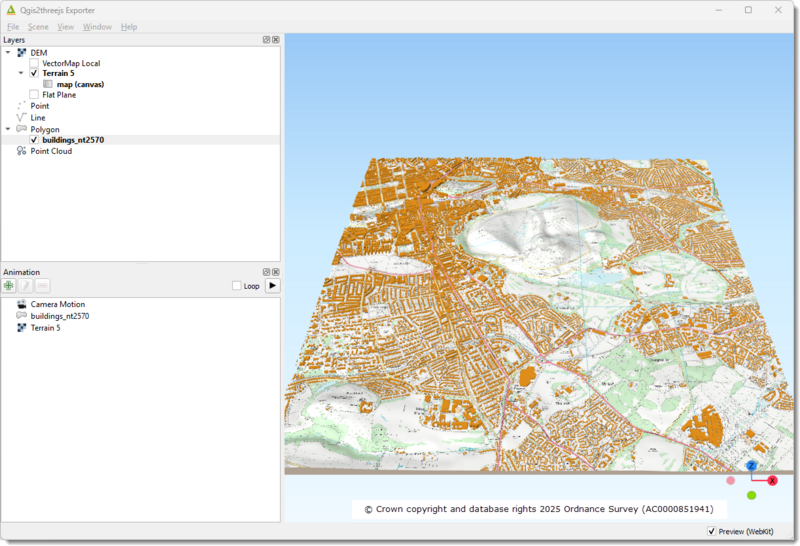
- The 3D scene will be updated displaying 3D buildings on top of the terrain surface.
Exporting the 3D scene
- Once you are happy with the 3D scene, it can be exported as an HTML page by selecting Export to Web… from the File menu.
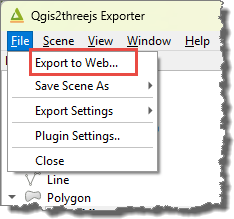
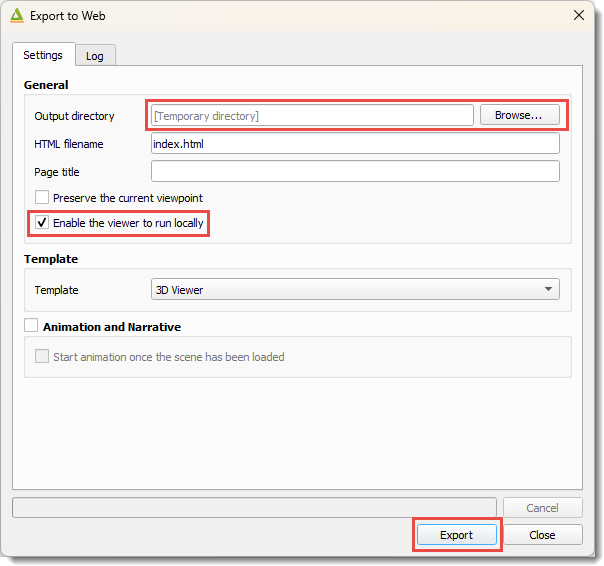
- On the Export to Web window set the following:
- Output directory: whilst you’re experimenting we recommend you leave this blank and the plugin will save the data in a temporary location, when you’re happy with the result you can use this setting to save your final visualisation.
- Enable the viewer to run locally: ensure this setting is selected.
- Press ‘Export’ to create the 3D model. Once it’s finished processing the model will open in your default web browser.
The plugin outputs an HTML file, along with a small number of accompanying files. The HTML file requires a WebGL compatible browser (WebGL is a method of generating dynamic 3D graphics using JavaScript), most modern browsers are WebGL compatible including IE 11, FireFox, Chrome, Safari. The Can I Use site offers further information on browser compatibility.
As the files are output as a web page, you can share the results of your work with colleagues without them needing to have any specialist GIS software, however you are not permitted to make the website publicly available as the html and javaScript files contain map data rather than just images of maps. The Digimap licence does not permit the sharing of licensed data from Digimap with anyone other than registered users of the service: see licensing details.